Member supply chain assessment data stays in the system as long as the brand member wants to keep it there. As brand members collect more supplier assessments over time, they can use reporting and data analytics to determine common issues across many suppliers, and root cause issues. Many existing FFC members us FFC as a way to collect, report and share with the investment community the progress they are making in their supply chain sustainability efforts. This includes progress they are making under the UN strategic development goals (SDGS). However, to produce reports with this level of public understanding it is important to collect data in ways that can be reported easily.
FFC reporting tools consist of two types:
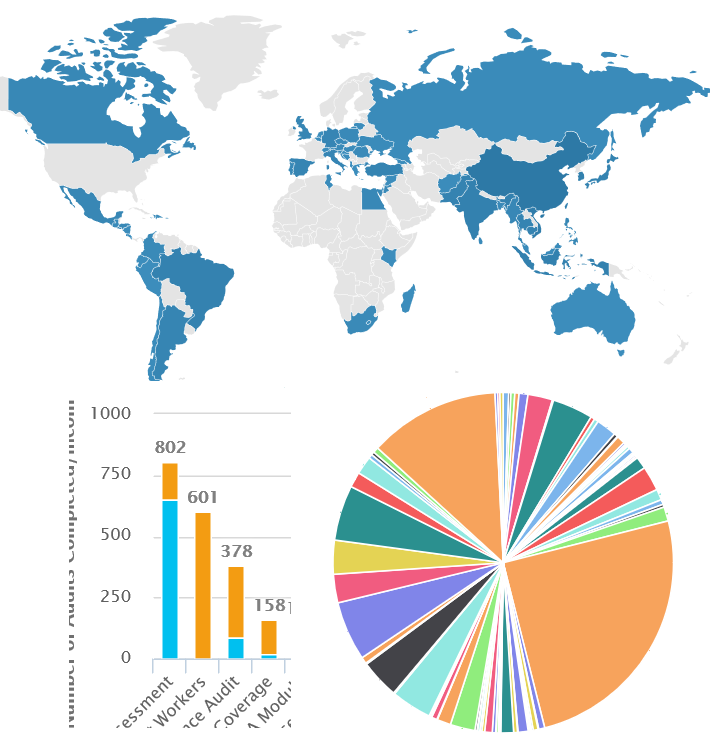
Widgets are interactive data displays that FFC develops for member dashboards so every FFC member regardless of size and number of staff, can have some basic dashboards if they want them. Each FFC member system administrator can decide to turn widgets on or off, and delegate further to their users. These data displays might be real time, or might include historical time series data comparisons. Widgets are usually based on once a month data summarizations, and they appear automatically providing all members with some level of visual data display. Widget data can be exported to MS Excel for additional analysis.

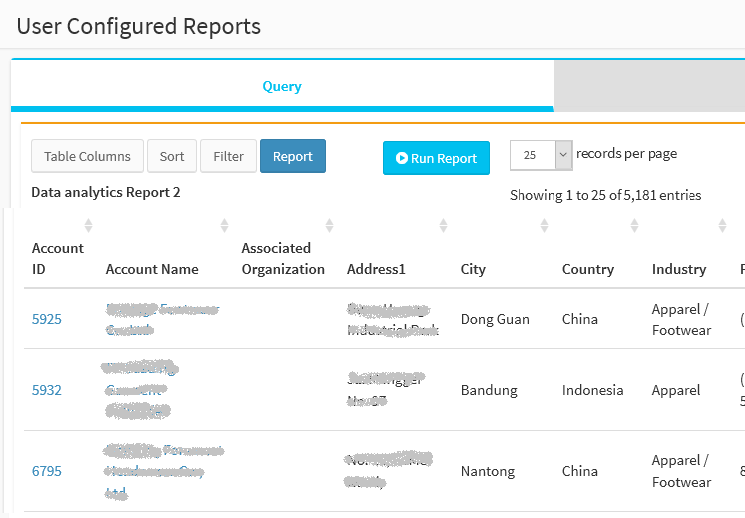
FFC provides an easy to use reporting tool that systems administrators and others can use to produce on demand reports from their data. All results can be exported to MS-excel for future analysis. These reports can be stored in a library and reused over and over. They can also be scheduled to run at specific times every month. Users can easily select the data elements in the database they want to report on, establish data filters with ease, and choose data sort orders and presentation orders all without programming. UCR is one of FFC’s most used and popular features because it lets brand members respond immediately to any unanticipated reporting need.
